Chapter 11 The Power of R & R Markdown

Indentation and spacing is very important! In the text, it is better to add more. In the YAML header, it may not be recognized properly with improper spacing
11.1 Reporting with the apa & papaja packages
- You know the
papajapackage already fortheme_apa()in data visualization - The package also has many wrapper functions to make reporting in R & R Markdown a lot easier
- "apa_print()"
- Chi\(^2\) Test reporting cannot be achieved with this, so we use apa::chisq_apa() for that
11.1.1 Usage
# Chi (add format = "rmarkdown" if needed)
apa::chisq_apa(chisq.test(seminar$v07_genre, seminar$soul_dummy))
# Warning in chisq.test(seminar$v07_genre, seminar$soul_dummy): Chi-squared
# approximation may be incorrect
# chi^2(2) = 2.14, p = .344

# t-test
papaja::apa_print(t.test(v05_skill_tech ~ v01_gender, data = seminar, alternative = "greater"))$full_result
# [1] "$\\Delta M = 10.50$, 95\\% CI $[-109.56, \\infty]$, $t(1.28) = 0.39$, $p = .377$"

# ANOVA
papaja::apa_print(aov(v08_loudness ~ as.factor(v07_genre), data = seminar))$full_result |> suppressMessages()
# $as_factorv07_genre
# [1] "$F(2, 10) = 2.56$, $\\mathit{MSE} = 120.80$, $p = .126$, $\\hat{\\eta}^2_G = .339$"
# suppressMessages() is a useful helper function that avoids any messages from the function it is used with. Here it would just tell us "For one-way between subjects designs, generalized eta squared is equivalent to eta squared. Returning eta squared.""11.2 The papaja Package
reporting is very easy with these packages
they provide "wrapper" functions around statistical tests that allow for dynamic, correctly formatted reports
most can be accomplished with the papaja package
only the chi^2 test needs the
apapackage but the principle is the same
11.2.1 Markdown Templates
papaja has R Markdown templates and they are awesome for writing scientifically sound papers according to APA guidelines
There are many other awesome templates that are available for styling and creating R Markdown documents. The example in Figure 10.1 was written with the oxforddown template! You can write nicely formatted letters with the linl package!
11.3 Taking full advantage of R
- Conduct Analysis, e.g. an ANOVA
- Write about your analysis & report results (with proper statistics)
- Choose and create an appropriate visualization, e.g. a boxplot
11.3.1 Walkthrough
We will use the package palmerpenguins (install.packages("palmerpenguins")) and see whether penguins from different islands have different body mass.
library(palmerpenguins)

# Test assumption of homoscedasticity
car::leveneTest(aov(bill_length_mm ~ species, data = penguins)) # yay
# Levene's Test for Homogeneity of Variance (center = median)
#        Df F value Pr(>F)
# group   2  2.2425 0.1078
#       339
# Run & save post-hoc Tests
TukeyHSD(penguinmodel)
# Tukey multiple comparisons of means
# 95% family-wise confidence level
#
# Fit: aov(formula = bill_length_mm ~ species, data = penguins)
#
# $species
# diff lwr upr p adj
# Chinstrap-Adelie 10.042433 9.024859 11.0600064 0.0000000
# Gentoo-Adelie 8.713487 7.867194 9.5597807 0.0000000
# Gentoo-Chinstrap -1.328945 -2.381868 -0.2760231 0.0088993- For anova, we want to report the full statistics, a.k.a "full_result" from
papaja::apa_print()
Create a boxplot and add results right in the caption!
library(ggplot2)

ggplot(penguins, aes(x=species, y=bill_length_mm, color=species, fill=species), na.rm=T) +
  geom_boxplot(alpha = .7) + theme_apa() + theme(legend.position = "none") +
  labs(x = "Penguin Species", y = "Bill Length (mm)",
       caption = latex2exp::TeX(unlist(apa_result))) +
  scale_color_brewer(palette = 5) +
  scale_fill_brewer(palette = 5)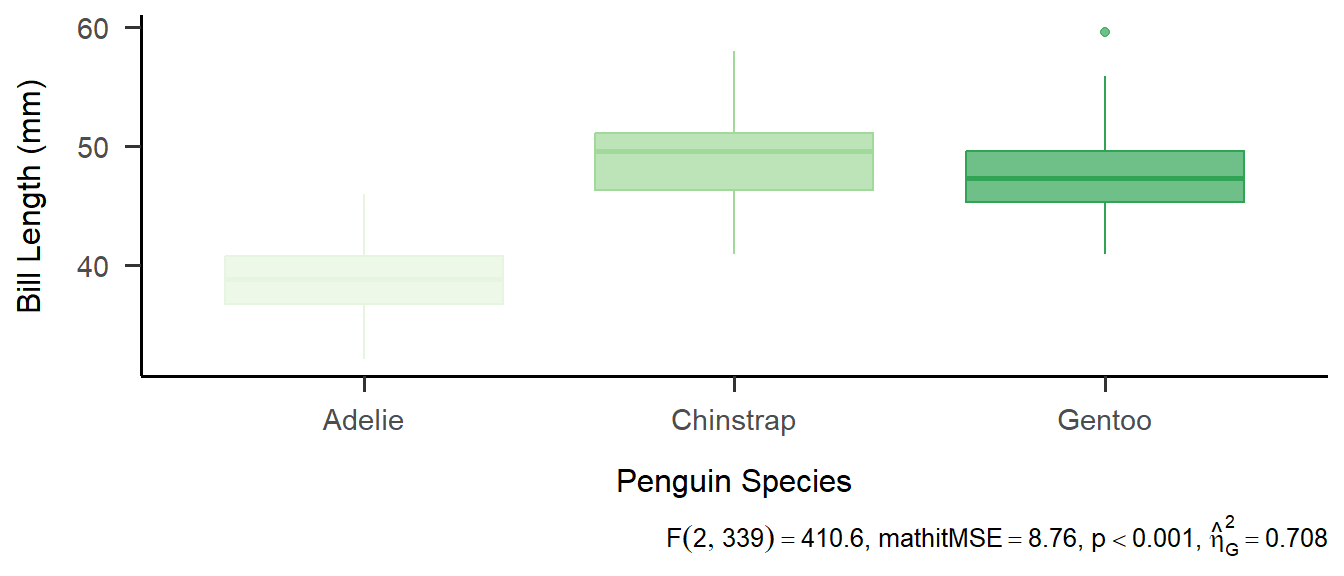
- Note that it is a little complex to include the result right in the caption
- ggplot2 cannot handle notation so we need to use package latex2exp
- the TeX function from that package cannot handle the list-output from apa_print()$full_result so we need to "unlist" that
- Using RMarkdown, it is much easier to include the statistic right in the text with inline code:
- `r apa_print(penguinmodel)$full_result`
- \(\rightarrow\) \(F(2, 339) = 410.60\), \(\mathit{MSE} = 8.76\), \(p < .001\), \(\hat{\eta}^2_G = .708\)
- `r apa_print(penguinmodel)$full_result`
Exercise
Create an R Markdown Document that includes the same type of analyses of variance with all steps that we have conducted before.
Please use the penguins dataset from the palmerpenguins package and take "species" as the independent variable and "flipper_length_mm" as the dependent variable.
leveneTest(aov(flipper_length_mm ~ species, data = penguins))
penguinmodel2 <- aov(bill_length_mm ~ species, data = penguins)
posthoc <- TukeyHSD(penguinmodel2)
apa_result <- apa_print(penguinmodel2)$full_result

ggplot(penguins) +
  geom_boxplot(aes(x = species, y = flipper_length_mm, color = species, fill = species),
               alpha = .7, na.rm = TRUE) +
  theme_apa() +
  theme(legend.position = "none") +
  labs(x = "Penguin Species", y = "Flipper Length (mm)") +
  scale_color_brewer(palette = 5) +
  scale_fill_brewer(palette = 5)
Wrap-Up & Further Resources
- Rmd offers many options for customization
- Analyses can be conducted and reported in the same document
- We can profit from many automatizations, e.g. chapter numbering
- Single values/ results can be reported with inline code
- MarkdownGuide
- Another Markdown Cheatsheet
- apa package
- papaja package
- ggsignif package example
- Bibliography and Citation